
If you ask anybody, they will tell you that data is valuable.
But what they are likely referring to is data analytics (i.e. reporting, dashboarding, predictive analytics, etc.). This is the output of data. To get to this stage, where data is centralized and made easily available for analysis, you need a data pipeline.
This is where data engineering comes in.
A data engineer focuses on the sources of the data, quality, structure, formatting, accessibility, security, governance, and so on. All of these are extremely important to generate value for the organization.
In this post, we look at what is a data pipeline, how it works, and what is its underlying architecture.
Data is water
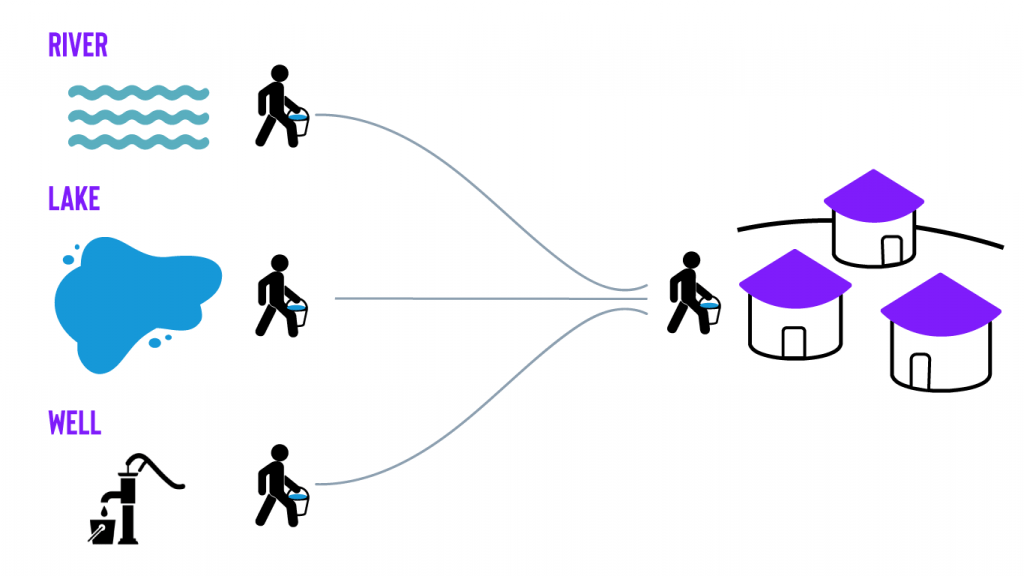
This is a perfectly suitable solution and achieves the desired result. But, as the village expands and their water needs increase, these traditional methods may become too inefficient.
What’s needed is a new delivery method that increases the water supply easily and with far less effort.
A more efficient solution would be to build a pipeline that automatically takes the water from these sources and delivers it to the village. This may even open up new uses for water that were previously impossible. An analogy we like to use here at Infostrux is ‘data is water’.
We view data engineers as plumbers, creating a network of pipes connecting and delivering water to the consumer.
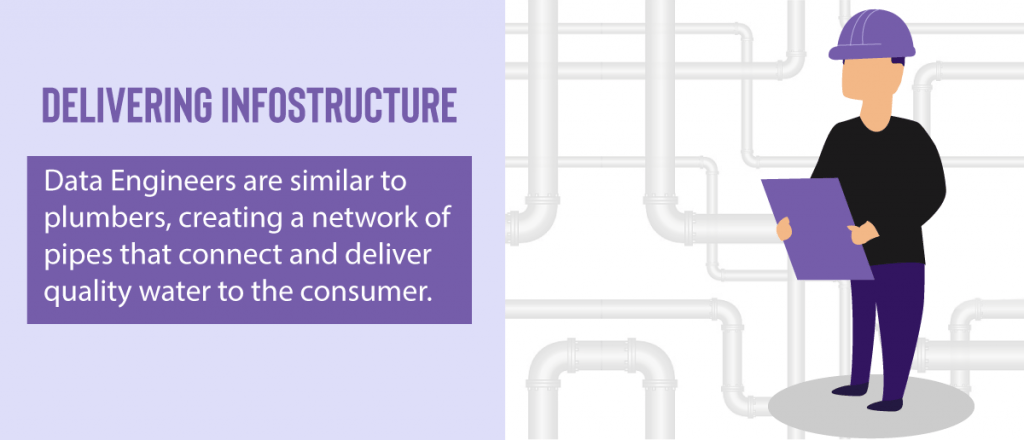
Thinking about data in this way, data engineers lay the ‘info’structure for reliable and trusted data to be delivered to make it available and easy for business intelligence, reports, dashboards, and other applications.
It's not just about piping data; a data engineer needs to be thoughtful about the quality of the data being passed through the pipes and how it will be used for business analysis.
This ensures only quality water (or data) is being delivered.
What is a data pipeline?
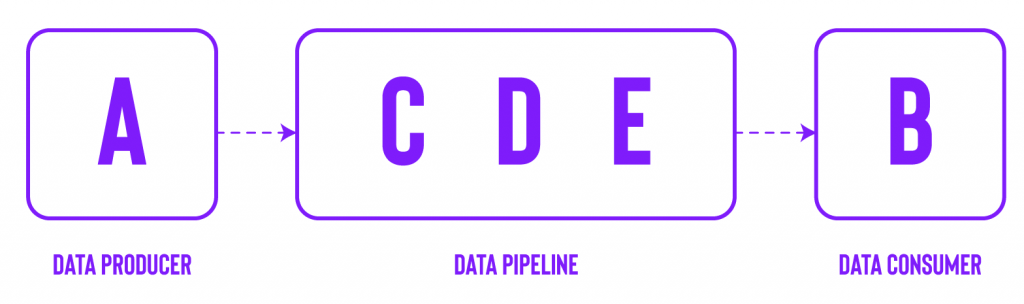
A data pipeline is similar to the above water pipeline example. It’s a much more efficient mechanism to transfer data from point A to point B, with some intermediary steps in between.
The data producer (A) represents the various data sources. The in-between steps (C, D, and E) are where the data is ingested from the sources, cleaned, integrated, stored, modeled, documented, secured, and governed.
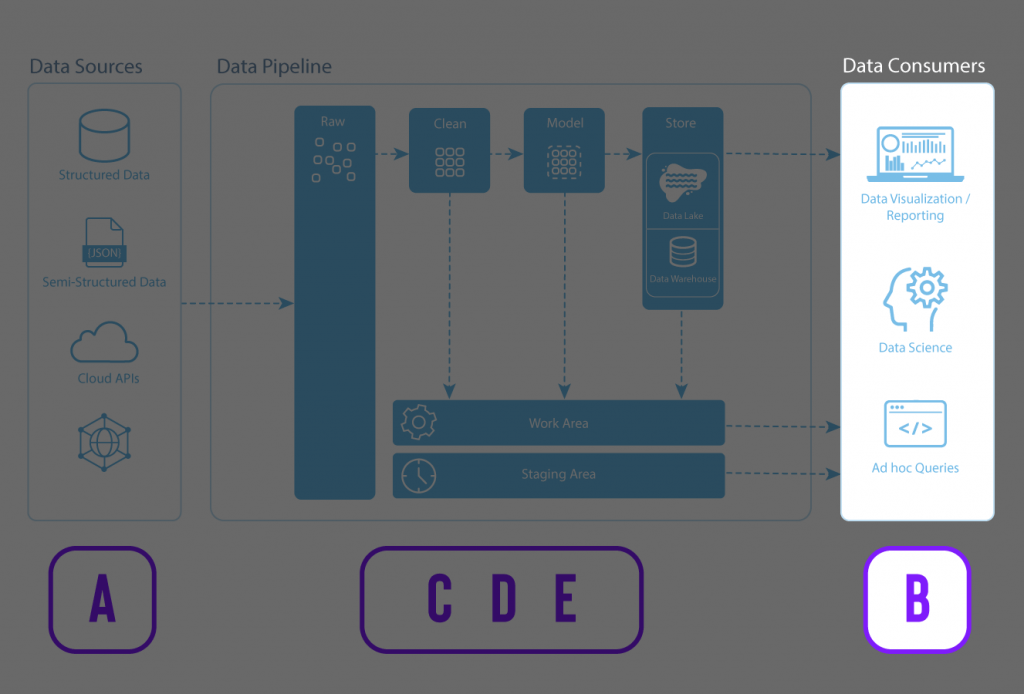
Finally, the data becomes usable by the data consumer (B), who creates reports, dashboards, and other data applications with the data.
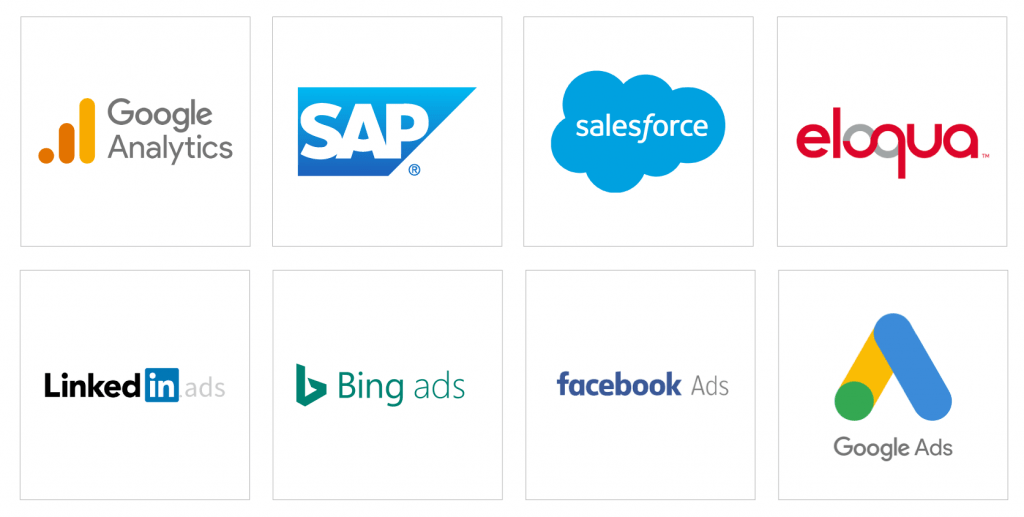
Data sources
- Google Analytics
- CRMs
- ERPs
- Various ad platforms
- Sensor data
- IoT
- Cloud APIs
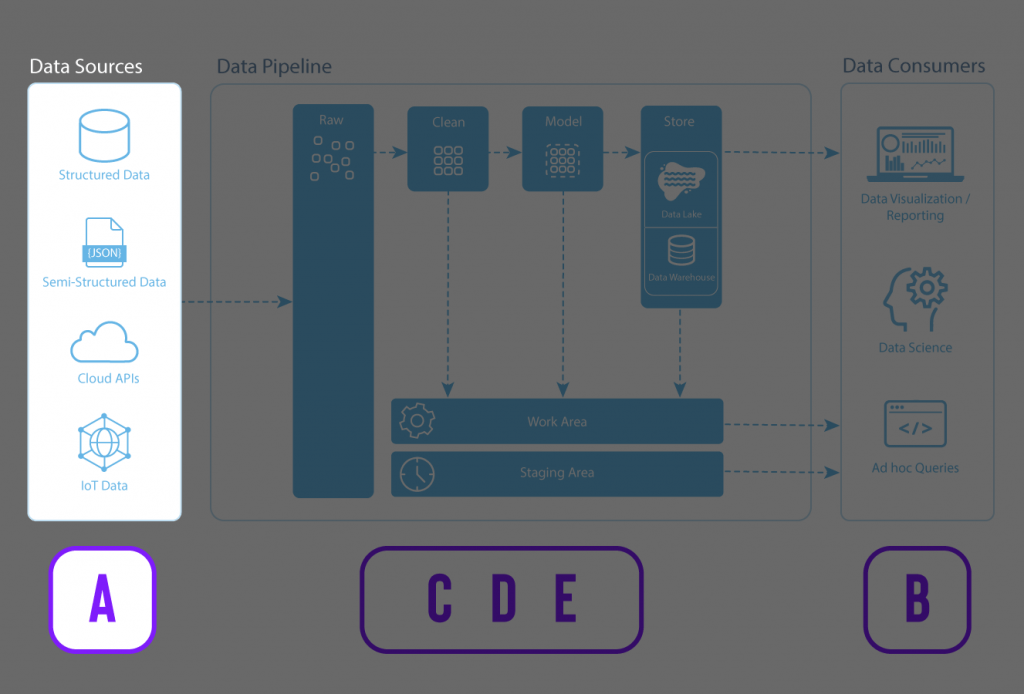
Here are some common data sources that a company may want to ingest into a data pipeline focusing on marketing data.
Data Pipeline
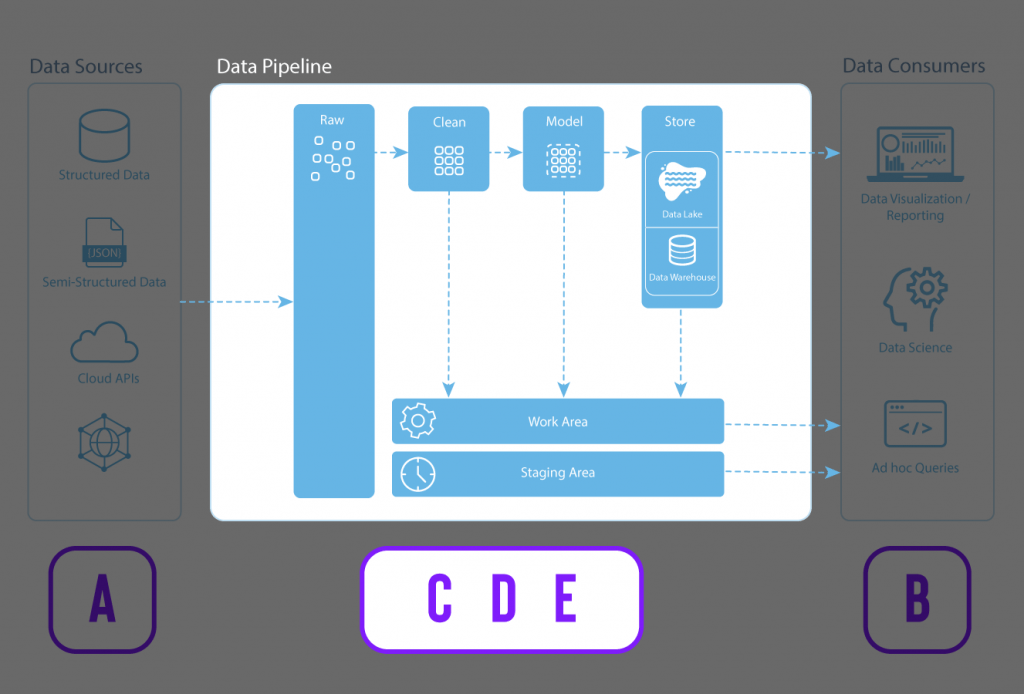
Raw – Data is ingested from the data sources. The raw data can be structured, semi-structured, or unstructured. Using Snowflake, data can be easily loaded from the raw area with high velocity, high variety, and high volumes.
Clean – Cleaning, or wrangling data, is finding and fixing errors in your dataset in preparation for analysis. This includes typos, inconsistencies (e.g., CA, CAD, CAN, Canada, or LA, Los Angeles), incomplete information (e.g., dates missing the year), inaccuracies, irrelevancies, etc. This is where the raw data is transformed into more curated datasets.
Model – Data modeling is the process in which data is further refined into consistent structures of defined measures (things you can measure such as revenue, cost of goods, gross margin, units sold, etc.) and dimensions (things that cannot be measured such as area codes, sales associates, location, product type, date, etc.). In the modeling stage, you can also enhance your data by establishing hierarchies, setting units and currencies, and adding formulas to make your analysis easier and consistent.
Store – Data is stored in a data repository such as a data lake, data warehouse, or data mart. Depending on the needs of the business, each of these data stores serves different purposes.
Work & Staging – Data engineers and data scientists typically use the Work & Staging areas to handle operational tasks for managing the data pipeline and preparing and testing some transformations.
Data consumers
After the data has been ingested, cleaned, modeled, and stored, it is ready for consumption.
Data consumers can now use clean and reliable data in meaningful ways, from data visualization and reporting in a Business Intelligence (BI) tool to data science applications such as predictive and ML models and ad hoc SQL queries.
ETL vs. ELT?
A digital transformation has been taking place, with many organizations migrating from on-premise servers to the cloud.
The transformation brings a host of benefits, which include a shift from a traditional on-premise ETL data pipeline process to a cloud-based ELT process.
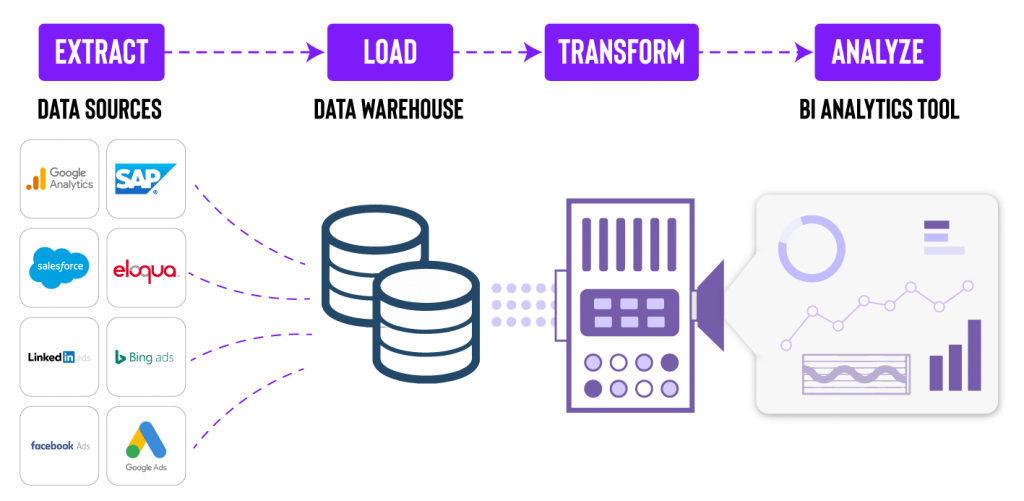
ELT stands for “extract, load, and transform” — it describes a data pipeline process where data is taken from a source, replicated, placed in data storage, and then transformed.
-
- Extract – data is taken from a data source
- Load – moving data into a data storage system such as a data lake, data warehouse, or data mart. In an ETL model, data goes into a staging area.
- Transform – the process of changing the data’s structure into consistent formats so that it can be used for analysis and other data applications
In an ETL model, transformations occur before the load phase, resulting in a more complex data replication process. However, it is ideal when a destination requires a specific data format. ETL tools require processing engines prior to loading data into the destination. ETL is ideal for organizations looking for data compliance and privacy since it cleans sensitive and secure data before sending it to the data warehouse.
With ELT, organizations can use a BI tool to transform data, thus removing a step and making the data-loading process more streamlined. ELT is an optimal approach for cloud data warehouses since organizations can transform their raw data at any time and avoid a step in the data pipeline.
One important advantage to using the Snowflake data cloud platform is that transformations and modeling use SQL, a common programming language familiar to most data teams. This allows data scientists and analysts in most organizations to work with the data in a language they all understand.
The benefits of ELT
ELT, cloud-based data warehouses, and data lakes have several benefits over ETL and on-premises hardware.
- Flexibility – since data sources and formats can vary and change frequently, ELT provides the flexibility to produce transformations on demand. This enables you to replicate and transform your raw data when necessary. Using ETL requires configuration and transformations in advance.
- Scalability – cloud data platforms such as Snowflake offer usage-based pricing, which allows you near-unlimited scalability within seconds or minutes. In contrast, on-premises data warehouses require organizations to purchase, install, configure, and maintain new hardware as their storage needs increase. Among many other disadvantages of on-premise servers, it can increase costs significantly.
- Time to value – ELT transforms data within a target system, enabling data scientists and analysts to work with large volumes of data more quickly. At the same time, ETL requires a labor and resource-intensive manual coding process to ensure data conformity and uniformity prior to loading or integrating data.
For further reading, check out: 5 Mistakes Organizations Commonly Make with Data.